Original Research Article
Year: 2017 | Month: Jan.-March | Volume: 1 | Issue: 1 | Pages: 1-16
Client Satisfaction and It’s Determinants With Anti-Retroviral Therapy (ART) Services in Public Hospitals of West Wollega Zone, Ethiopia: A Cross Sectional Study
Ashenafi Habtamu, Yibeltal Kifle, Yohannes Ejigu
Adama Sciences and Technology University, School of Health Sciences, Department of Public Health, Asella, Ethiopia
Corresponding Author: Ashenafi Habtamu
ABSTRACT
Background: Highly Active Antiretroviral Therapy (HAART) represents the single most important advance in the treatment of HIV infection since the onset of the HIV/AIDS pandemic. Client satisfaction has long been considered an important component of care outcomes. Satisfied and dissatisfied patients behaved differently and causes of client dissatisfaction may multifaceted. The objective of this study was therefore, to assess factors associated with level of Clients satisfaction and it’s determinants at ART Clinics.
Methods: health facility based cross sectional study was conducted on 266 ART users of three Public Hospitals in Western Wollega Zone, West Ethiopia. A total sample was proportionally allocated and individual study participant was identified from consecutive clients who full fill the inclusion criterion (PLWHAs aged 18 and older). Data was collected using Exit interview by instruments translated into the local language and was analyzed using SPSS for Windows version 20.0. Factor score was computed for items that were identified to represent the satisfaction scale by varimax rotation method. By using this regression factor score, Multivariate linear regression analysis was performed and the effect of independent variables on the regression factor score was quantified.
Result: The three extracted underlying latent factor have reliability coefficients ranging from 0.709 to 0.820 with overall satisfaction level of 57.62 %. Predictor variables like monthly income, consultation time and perceived level of stigma and discrimination and satisfaction factor scores had strong statistically significant association. Study participants who consulted for 15-30 had an average of 0.758 units increase in their satisfaction scores as compared to respondents who consulted for less than 15 minutes as explained by reliability and responsiveness satisfaction factor score. Some of the explanatory variables like perceived current health status and waiting time were not statistically significant with satisfaction score.
Conclusion: This study identified 57.2 % overall level of ART client satisfaction. Client provider interaction and assurance, reliability and responsiveness and tangibility were the three underlying latent factors that determine level of client satisfaction towards ART services. Therefore, health care providers and peer educators should work towards improving the level of client satisfaction.
Key words:client, satisfaction, underlying latent factors, factor analysis.
INTRODUCTION
HIV/AIDS has had a shattering impact on many countries in the past three decades, especially in sub-Saharan Africa and South East Asia and has become one of the world’s most serious health and development challenges.(1- 4)
Despite this, the introduction of Highly Active Antiretroviral Therapy (HAART) in 1996 restored hope in HIV/AIDS patients. (5) HAART represents the single most important advance in the treatment of HIV infection since the onset of the HIV/AIDS pandemic. Within the short time since its introduction, HAART had dramatic effects in reducing the viral load of persons with HIV, improving their immunologic status, physical health and often quality of life, and has contributed directly to unprecedented declines in HIV related morbidity and mortality. (5,6) Furthermore, the introduction of ART drugs initiated the decrease in stigma and discrimination (2) and increase in HIV/AIDS status self-disclosure in PLWHA. (7,8)
As common for others sub-Saharan Africa countries. (1- 4) Ethiopia is one of the country’s most affected by HIV / AIDS. The overall HIV prevalence is 1.5% among the general population. The prevalence among males and females were 1.9% and 1% respectively. This prevalence also varies among rural and urban population as a results of different socio-economic and cultural aspects. (4)
In Ethiopia, in 2001 the National HIV/AIDS Prevention and Control Council declared that HIV was a national emergency, leading to various interventions particularly focusing on prevention and behavior modification. HIV/AIDS problem is considered as burning issue by community and government in additional to other common health problems that the country was suffering for a long period of time. In 2003, fully cognizant of competing demands of equal magnitude such as famine, malaria and tuberculosis and the uncertainty of program sustainability, the Government of Ethiopia elected to introduce the ART program (9) with the goal to prolong the lives, to restore the mental and physical functions and to improve the quality of life of PLWHA. This program will impact mortality, reduce fatalistic attitudes such as stigma and discrimination, promote increased voluntary HIV testing, and provide a rationale for making healthy living choices. (10,11)
Free ARV service was launched in January 2005 in Ethiopia and public hospitals started providing free ARVs in March 2005. (10,11)
After 2005, HIV care and ART services were further decentralized in Ethiopia. This is due to the fact that 85% of population is vested in rural areas, despite that the affordability is other problem that can hinder utilization of the services. Private hospitals and health centers started delivering ART and HIV care in June 2006 to further address those in need by breaking geographical barriers. This was in line with several African countries that adopted the private and public health approach to scale up access to ART, provide care and treatment to HIV/AIDS patients. (11,12)
Even though various definitions are forwarded for patients satisfaction by various individuals and organization, majority of the scholars argued as Patient satisfaction is the extent to which the patient feels that their needs and expectations are being met by the service provided. In addition to that patient satisfaction is a subjective judgment of the quality of care. (13-16) However, it has long been considered an important component of care outcomes and is frequently integrated into evaluations of overall clinical quality. Over the past many years, health service researchers reported that satisfied and dissatisfied patients behaved differently; satisfied patients were likely to comply with treatment, keep follow up appointments and utilize health services. Such behavioral consequences related to satisfaction could affect outcome of care and health seeking behavior. (15-18)
Despite this, the methodological issue is one of the main important component in various patient satisfaction Surveys. For example, Definition, measurement, reliability, validity and factor structure were not defined in equivocal sound as result of different complexity of health care behaviors as compared to other services. (13-15)
However, issues of clients’ satisfaction are not an emerging phenomenon to health care organization. Clients are one of the main stake holders among the ever developing modern world of medicine including developing countries. Although the roles of clients and health care provider have remained constant, (16) the contexts and backdrops have undergone tremendous changes overtime. This may indicated as the role of health care provider is to treat clients only based on their scientific knowledge whereas the role of client is considered as dormant recipient of services prescribed by their physicians. (19)
Studies have shown that consumers of Primary Health Care (PHC) in rural Africa did not visit their local centers even for severe illness due to perceived low quality of healthcare at these centers. Patient satisfaction is a complex, multidirectional issue that needs to be approached from several different angles. Patient outcomes in terms of quality of life and compliance have been linked to level of patient satisfaction. (19)
In earlier times, there were no clear demarcations between patient care and patient cure. With changing patterns of disease like from communicable to non-communicable, newer therapies and patients’ perceptions, care and cure are now entirely separate concepts. A patient may never get cured but may feel very well-cared for and vice versa. (19)This may result from different reasons such as severity of illness, genetic, nutritional, behavioral factors and etc. In addition to that the health care delivery system and the health care provider manner may have its own role to properly handle health care consumers. Moreover, currently the health care industry is undergoing an alarming transformation to meet the ever-competing interest and demands of its patient population and their families. In addition to that, health care’s facilities are changing their views towards patients from blindly ignoring the patients’ voice to give chance to say and decided something about their health under certain circumstances. (20)
As other developing countries, in Ethiopia the delivery of quality health services is central to improving the health status of the population. In addition, satisfying patients and clients is the primary goal of the Government’s reform programme such as business process re-engineering (BPR) and balanced score card (BSC). One of the objectives of Health Sector Development Program four (HSDP IV) (which is in action now) of Ethiopian Federal Ministry of Health (FMOH) is that the creation of a health system that satisfies the community’s health care needs through the fulfillment of the required inputs, delivering safe and optimum quality of health services in an integrated and user-friendly manner. (21)
This may result from the thinking that healthier population are more productive than others as a result of spending most of their time on production which may increase national development in addition to minimizing catastrophic health expenditure and other ill health conditions.
Therefore this study is conceptualized to generate baseline data for the indicator-Percent HIV positive Clients who utilize ART services and report their level of satisfaction with their service experience’ in Public Hospitals in western Wollega Zone. The premise for the study is anchored in the evidence indicating that as the services improve, more clients access the available services and overall satisfaction quotient improves. This makes possible improved uptake of/ adherence to prevention and treatment, ultimately impacting on the disease burden in the long run.
In addition to that this study contribute to policy by documenting good practices and help policy makers to pick and apply lessons learned to ensure a successful strategy to fight HIV/AIDS and encourage satisfying ART services, which is necessary if we are to achieve “AIDS free generation”.
Hence, the research question of this study was: “what are the major client satisfactions and it’s determinants with anti-retroviral therapy (ART) services in public Hospitals of West Wollega Zone?
METHODS AND MATERIALS
Study area and period
The study was conducted in three Public Hospitals of Western Wollega Zone. West Wollega is one of the 18 administrative zones of Oromia Regional State. The zone has an estimated total population of 1,351,979 of whom 50.46 percent are females.
There are three public hospitals, two Non- Governmental Organization (NGO) Hospitals, 81 health centers and 533 health posts found in West Wollega zone administration those currently providing health care services to the residents of the zone. Regarding to human resources for health there are about 2192 health care professionals and 607 administrative and supportive staffs of which the three Public Hospitals shares 209 health care professionals and 176 administrative and supportive staffs. The three Public Hospitals are located in Gimbi, Najjo and Begi towns with the distance of 441, 515 and 721 K.M.s from Addis Ababa the capital city of Ethiopia respectively.
They have about annual clients’ flow of 104,000 and 167 beds in general. They are currently providing HIV/AIDS treatment, care and support including Free ART services for PLWHA even though they started at different time and they are the study sites for this particular study.
Population
The study population was included clients who visited the ART clinic at three Public Hospitals in West Wollega Zone during the study period. A client was included in the study if he/she is aged 18 years or older using ART who were on follow up. The sample size was calculated assuming p, proportion of satisfaction in this group is 50%, since there is no similar research which was conducted in the area and other similar setting in recent years. Other assumptions made during the sample size calculation were 5% marginal error (d) which show that the error introduced due to sampling procedure is only tolerable as much as five percent of the total sample size and confidence interval of 95%. Based on these assumptions, the sample size was calculated as follows:
A z-value of 1.96 was used at 95% CI and d of 5%. (n= sample size, p= prevalence, d= margin of error).
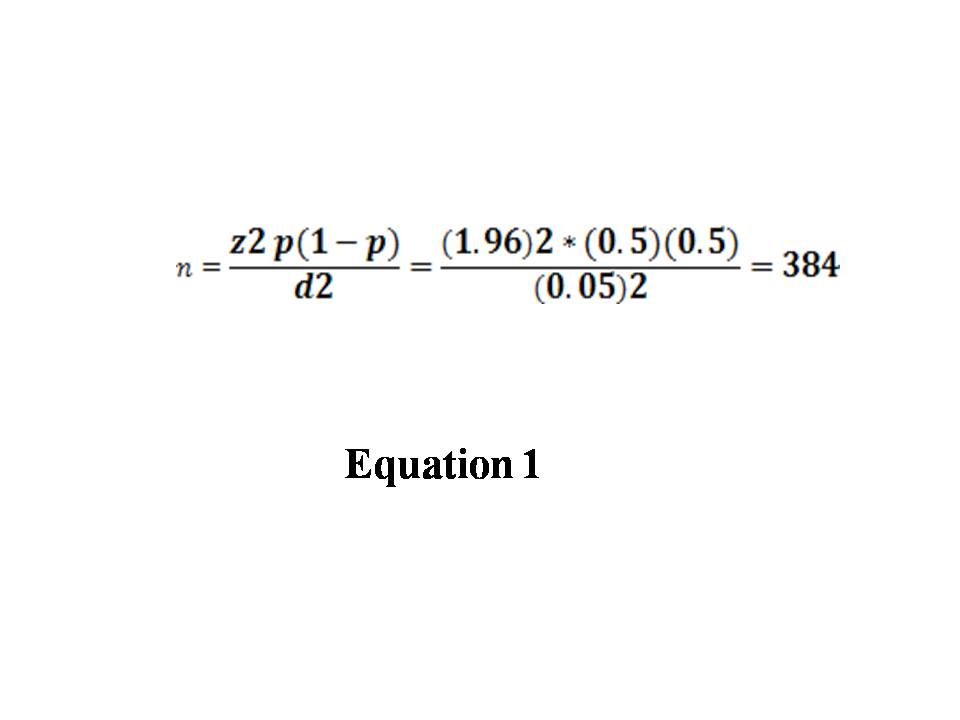
Therefore the minimum sample size was 384 .Since the number of ART users in three Hospitals were less than 10,000 (N=641), correction formula was considered
So with adjustment for non-response, incomplete responses and refusals (10% contingency) n= (242+24), the final sample size was 266.
Sampling procedure
All Public Hospitals found in Western Wollega zone was included in the study. Number of study participants was assigned proportionally based on the number of ART users in each Hospital. As a report from these respective hospitals about 641 clients’ were using ART services during the data collection period (Gimbi Hospital=136, Najjo Hospital= 419 and Begi hospital=86). Individual study participant was identified from consecutive clients who full fill the inclusion criterion (PLWHA aged 18 years or older) and included in the study until the allocated sample size was obtained in each of the three Public Hospitals, with the starting point as the first client who came for care each day at the time of data collection period.
Data collection instruments
Data on the level of clients’ satisfaction and its determinants on ART services in Public Hospitals in Western Wollega zone were collected using structured questionnaire at exit interview. The questionnaire were adapted from patient satisfaction survey for HIV Ambulatory care (22) and it was translated to local language and again to English to confirm the correctness of the translation by language expert. Even though the tool was developed for HIV Ambulatory care in general which contains different perspectives, it was adapted to the ART services which is one of the main components in its original content. The questionnaire had four parts, the first part explore detailed questions on predictor factors like socio-demographic characteristics of clients that have its own impacts on ART services satisfaction.
The second, third and fourth part measured the subjective measures of Client provider interaction and assurance, reliability and responsiveness and tangibility respectively.
Data collection method
The study participants responded to the questionnaire in their own respective care received from the clinic after being oriented as to how to do it by trained data collectors and supervisors. The questionnaires were filled by data collectors. The data collectors were 3 males and 3 females’ clinical nurses and supervisors were two males (Health Officer) and one female (BSc. nurse).
Both the data collectors and supervisors were selected from health centers and District Health office and had temporary identification card (badge) to decrease fear of study participants from their future services and they were trained for two days before data collection and there was continuous supervision.
First the purposes and the importance of the study was clearly explained by their ART physician/expert patients when the study participants came for services and they referred to data collectors who wait for them in private counseling room if they showed their interest. The data collectors again clearly explained the purposes and importance of the study and informed study participants that the study was being conducted by other body than Hospital management and staffs.
Written informed consent was secured from each study participant by data collectors based on the information and consent form prepared for this particular study after explaining the expected research benefits and risks. Interview was continued by data collectors starting from socio- demographic characteristics to all the rest.
Data analysis
Data was edited, coded and entered into computer using EpiData version 3.1 Software. The entered data was exported to SPSS version 20.0 software for analysis. The results were then expressed as mean, frequency and percentage.
Data were then subjected to Factor Analysis (FA) to identify the fewest number of factors that can be representing the areas covered by the items. Kaiser-Meyer-Olkin (KMO> 0.5) Measure of Sampling Adequacy, Bartlett’s Test of Significance (0.000) was used to test suitability of the data to factor analysis. Principal component extraction and varimax rotation was used to identify meaningful factor with communalities and factor loading of greater or equal to 0.5 and 0.4 respectively. The first category measured of Client provider interaction and assurance items of the client’s perception of the provider’s characteristics towards them and assurance during the ART services encounter. Within this tool clients were asked 12 questions to rate different aspects of client provider’s interaction and assurance. Each question was scored on an ordinal scale from ‘strongly disagree (1)’ to ‘strongly agree (5). All twelve items summed together yield a maximum score of 60 and a minimum of 12. These 12 items were based on the following questions: your providers told you importance of strictly keeping service appointment, perceived knowledge of their providers about their conditions, their provider’s fairness, providers’ accept your complaint and not ignore your issues, easy to understand providers’ explanation for your questions, your providers’ are non-judgmental and accept your idea about your health choices, you got information in language you understood, service confidentiality and privacy, your providers explained side effects of HIV medication, your provider suggest you ways to remember HIV medication, explained when and type of medical test needed and your providers’ told you how to avoid passing HIV to others and re- infected by yourself.
The second category measured the reliability and responsiveness. Reliability and responsiveness of the health facilities and provider is the subjective judgment of the clients about the facilities readiness (capability) and professional skills and abilities of the health care provider to detect and manage their problem. It was measured by 9 items. Again each item was scored on a five-point Likert scale ranging from strongly disagree (1) to strongly agree (5) which yields a score range of 9-45.
The items covered getting prescribed HIV drugs, think of proper prescription, always getting properly prescribed drugs, health facility having functional equipment, distance from health facility, affordability of services, comfortable with the waiting time, your visits were not interrupted by other activities and make sure you understood your lab test.
The final category measured tangibility. In this category, clients were asked to rate three questions whether the health facilities, as a result of their consecutive visits, the place they are using is conveniently located, the services were well organized and the physical facility were visually appealing to them. All items were stated positively, each capturing response via an ordinal scale. Each item was scored on a five-point Likert scale ranging from strongly disagree (1) to strongly agree (5) which yields a score range of 3-15.
After all the items were subjected to factor analysis, one meaningful factor was identified for each category based on their Eigen value and total variance explained and their names retained as original name. Six, five and three items were loaded on the client-provider interaction and assurance, reliability and responsiveness and tangibility regression factor scores respectively and the rest were discarded during factor Analysis. Your providers’ accept your complaint and not ignore your issues, easy to understand providers’ explanation for your questions, your providers’ are non-judgmental and accept your idea about your health choices, service confidentiality and privacy, your providers explained side effects of HIV medication and their provider’s fairness were loaded on client provider interaction and assurance factor.
Easy of HIV medication, getting prescribed HIV drugs, think of proper prescription, always getting properly prescribed drugs, comfortable with the waiting time items were loaded on reliability and responsiveness factor. Finally, the place they are using is conveniently located, the services were well organized and the physical facility was visually appealing items were loaded on tangibility factor.
To observe the internal consistency of the items loaded on each factor reliability test was performed and reliability coefficient (Cronbach’s Alpha) greater than 0.7 was used as cut off point. Table 1 below showed the reliability coefficient and total variance explained by each factor.
Table 1:Reliability coefficient, total variances explained, mean score and SD of the three extracted factors for clients on ART, public Hospitals of West Wollega, West Ethiopia, April 2013 (n=255)
| Extracted factors | Cronbach’s alpha coefficient | Total variance explained | Mean | SD |
| Client provider interaction and assurance | 0.709 | 65.05% | 3.91 | 0.48 |
| Reliability and responsiveness | 0.719 | 64.52% | 4.04 | 0.52 |
| Tangibility | 0.820 | 75.30% | 1.95 | 0.63 |
Using this regression factor score, associations between the independent and dependent variables were analyzed by multiple linear regressions and distribution of data was checked by Kolmogorov Smirnov test of normality. To identify determinants of client’s satisfaction with ART services in Western Wollega Zone, bivariate linear regression analysis was performed and the effect of independent variables on the regression factor score of the dependent variable was quantified. On bivariate linear regression analysis, Pearson’s correlation was used for continues data whereas Anova was used for categorical data.
The magnitude of the association between the different independent variables in relation to dependent was measured using unstandardized beta (B) and 95% confidence interval (CI) and P values below 0.05 will be considered to determine the actual predictors for the level of clients’ satisfaction.
In the first model, the effects of socio-demographic variables were assessed while in the consecutive model the effects of other predictor variables were considered. Finally, explanatory variables which had statistically significant association with the dependent variable (P < 0.25) were entered to the final regression model.
RESULTS
Characteristics of facilities
Regarding to human resource for ART clinic in the three Hospitals, each of them had one general Practioners (MD) as ART mentor, even though health care professionals make up was below the WHO recommendation in all of the hospitals. Accordingly, Both Gimbi and Nejo hospitals had one and three BSC nurse respectively, but Begi Hospital had not. The rest ART clinic health care professionals were clinical nurse (diploma holders) in the three hospitals. In addition to this, both Gimbi and Nejo Hospitals had three peer educators (sero-positive) each, but no any peer educator in Begi Hospital. Furthermore, each Hospital had one data clerk for ART clinic.
Out of the three Public Hospitals, only Nejo Hospital had functional CD4 count machine. In Gimbi Hospital, even though there is CD4 count machine it was nonfunctional and no CD4 count machine at all in Begi Hospital. As a result both the Hospitals refer their ART clients to the nearby Hospitals.
The availability of ART drugs in the three Hospitals had interruption in the supply due to different reasons. The problem was intense particularly in Gimbi and Begi Hospitals and the commonest drugs in shortage was cotrimoxazole.
Socio-demographic characteristics of the respondents
Two hundred fifty five clients aged 18 years or older were interviewed yielding a response rate of 95.8%. One hundred thirty seven (53.7%) of the respondents were females. The mean age of the clients was 33.1 (SD ± 6.7) years. The mean monthly income of respondents was 1195.5 (SD ± 822.1) Ethiopian birr (ETB). Regarding their residence, 190 (74.5%) of the respondents reside in urban areas. Ethnically, 192 (75.3%) and 29 (11.4%) of the respondents were Oromo and Amhara respectively. One hundred six (41.4%) and 72 (28.1%) respondents were Protestant and Orthodox respectively. More than half (61.2%) of the respondents were married and 70 (27.5%) and 65 (22.0%) were merchant and daily laborers respectively. Finally, 129 (50.6%) and 88 (33.7%) of the respondents attended grade 5-8 and higher classes (grade 9-12+) respectively.
Nature of visits
More than half (60.0 %) of the respondents received service for less than two years where as the remaining 102 (40.0) of respondents received for two and above years. One hundred ninety (74.5%) respondents visited the Hospitals to collect their ART drugs by two months, except in case of some complication with the average distance of 31.65 (SD ± 31.62) KMs. from the Hospital.
On the day of survey 152 (59.6%) of the study participants responded that they waited for less than 15 minutes to be seen by ART staffs. Moreover, 158 (62.0%) of the respondents reported that their consultation time was less than15 minutes. Concerning to services day, 253 (99.2%) of the respondent were served every day they came to Hospital without any restriction except off hours services such as evenings, weekends and Holidays, in which all the three Public Hospitals did not offer the services in such circumstance.
Perceived health status
Concerning to their self-judged current health status, 234 (91.7%) of the respondents rated their current health status as good and above good. Furthermore, 5 (2.0%) of the respondents rated their perceived health improvement after ART initiation as fair and the majority ( 98.0%) of the respondents rated as good and above.
Out of 255 participants responded to the interview 52 (20.4%) and 122 (47.8%) of them rated the perceived level of stigma and discrimination as low and medium respectively, whereas more than quarter 81(31.8%) of the study participants reported that still there is high level of stigma and discrimination in the Hospital and outside in the community towards people living with HIV/AIDS and their families. About three-fourth (72.5%) of the respondents rated HIV status disclosure to other individuals rated as below good, but more than quarter 68 (27.5%) of them were not worried and rated as good. Moreover, 167 (65.5%) and 62 (24.3%) of the respondents rated the perceived level of support from families, friends and others as very low and low respectively.
Level of satisfaction
To determine overall level of client satisfaction, internal consistency (Cronbach’s Alpha) were calculated for items loaded on each factor and in addition mean score was computed for the three underlying latent factors. Accordingly, the highest mean score (4.04/80.8%) was recorded for reliability and responsiveness whereas the least score (1.95/39.0%) was recorded for tangibility as shown on the table 1 above.
Since level of satisfaction was measured by scale on five point Likert scale, standardization was considered to help other researchers who interested to measure the level of ART client satisfaction on different point Likert scales for comparison. Accordingly, overall level of client satisfaction with ART was 57.62 % as calculated based on percentage of maximum scale score.
Determinants of satisfaction
In the bivariate analysis characteristics facilities showed statistically significant association with the client provider interaction and assurance, reliability and responsiveness and tangibility satisfaction factor score in the first three steps.
Socio demographic characteristics and client provider interaction and assurance satisfaction factor score showed statistically significant association on bivariate analysis. Accordingly, all entered variables had statistically significant association with satisfaction factor score. In the fifth step the associations between socio demography and reliability and responsiveness variables were assessed. Accordingly, residence, distance from Hospital, religion and occupational status showed statistically significant association with reliability and responsiveness satisfaction factor score. Variables related to socio demography and tangibility was entered into the sixth step and their importance was quantified.
As a result, distance from Hospital, ethnicity, religion and educational status of respondents had statistically significant association with tangibility satisfaction factor score.
In the seventh step, the effects of nature of visits with client provider interaction and assurance were assessed. Accordingly, duration of treatment, frequency of visits, waiting time, consultation time and service days showed statistically significant association with satisfaction factor score. Variables related to nature of visits and reliability and responsiveness was entered into the next model. As a result duration treatment, frequency visits and consultation time had statistically significant association with satisfaction factor score. In the 9th step, the effects of nature of visits with tangibility were assessed. Accordingly, both frequency of visits and consultation showed statistically significant association with satisfaction factor score.
Variables related to perceived health status and client provider interaction and assurance were entered into the next step. As a result, all entered variables into the model had statistically significant association with satisfaction factor score. In the eleventh step, the effects of perceived health status with reliability and responsiveness were assessed. Accordingly, perceived health improvement, perceived level stigma and discrimination, perceived HIV status disclosure and perceived level support of families, friends and others showed statistically significant association with satisfaction factor score. Variables related to perceived health status and tangibility were entered into the 12th step. Accordingly, all variables related to perceived health status showed statistically significant association with satisfaction factor score.
Variables showed statistically significant association with satisfaction factor score on bivariate analysis at p- value of 0.25 were candidate for multivariate linear regression and final models for the three factors extracted (dependent variables) were determined by using stepwise method.
The client provider interaction and assurance final model found to explain 53.7 % variability in satisfaction factor score. Accordingly, characteristics of facilities, monthly income, marital status, occupational status, consultation time, level of stigma and discrimination, perceived level of HIV status disclosure and level of support of families, friends and others were strong predictors of satisfaction score as explained by client provider interaction and assurance factor score.
For instance, being served at Begi Hospital had an average decrease of 0.591 units in their satisfaction score as compared to respondents who were served at Nejo Hospital (95% CI: -0.879 to -0.304). Study participants who were consulted for 15-30 minutes had an average increase of 0.330 units in their satisfaction score as compared who were consulted for only less than 15 minutes (95% CI: 0.114 to 0.546).
Perceived level of stigma and discrimination within Hospital and outside in community also has similar effects on client satisfaction score. As it moved from low to high, the regression estimates decrease from positive to negative. Respondents who rated perceived level of stigma and discrimination as high had an average of 0.232 units decline in their satisfaction score as compared to those who rated as medium (95% CI: -0.436 to -0.028). Similarly, as it moved from medium to high across perceived level of support of families, friends and others, the regression estimates value improve positively. Respondents who rated perceived level of support families, friends and others as medium and high had an average increase of 0.725 and 1.381 units respectively as compared respondents who rated as very low (95% CI: 0.402 to 1.049 and 0.550 to 2.213). Table 2 below summarize regression estimate of client satisfaction score explained by client provider interaction and assurance factor score and only variables that showed statistically significant association were displayed.
The reliability and responsiveness final model found to explain 57.9 % variability in satisfaction factor score. Accordingly, characteristics of facilities, occupational status, and frequency of visits, perceived level of stigma and discrimination and level of HIV status disclosure had statistically significant association with satisfaction score.
Respondents who were served at Gimbi Hospital had an average decrease of 0.430 units in their satisfaction score as compared to those who were served at Nejo Hospital (95% CI: -0.710 to -0.150). Study participants who were consulted for 15-30 minutes had an average of 0.758 units increase in their satisfaction score as compared to those who were consulted for only less than 15 minutes. (95 % CI: 0.065 to 1.071). Moreover study participants were daily laborers had average decrease of 0.318 units in their satisfaction factor score as compared to study participants who were merchant (95% CI: -0.593 to -0.043). In similar way, study participants rated their HIV status disclosure as very good had an average of 0.558 units increase in their satisfaction score as compared the study participants who rated as bad (95% CI: 0.045 to 1.071). Table 3 below displayed regression estimate of predictor variables on satisfaction score and only variables that showed statistically significant association were displayed.
Table 2: results of multivariate linear regression of client provider interaction and assurance for clients satisfaction on ART, public Hospitals of West Wollega, West Ethiopia, April 2013 (n=255)
| Explanatory Variables | No (%) | Unstandardized B |
Sig. | 95% CI for B |
Collinearity Statistics | ||
| Lower bound | Upper bound | Tolerance | VIF | ||||
| Characteristics facilities | |||||||
| Nejo Hospital* | 164(64.3) | ||||||
| Begi Hospital | 36(14.1) | -0.591 | 0.000 | -0.879 | -0.304 | 0.735 | 1.360 | Religion |
| Protestant* | 106(41.4) | ||||||
| Muslim | 68(26.9) | -0.390 | 0.000 | -0.606 | -0.174 | 0.806 | 1.241 |
| Marital status | |||||||
| Married* | 156(61.2) | ||||||
| Widowed | 38(14.9) | -0.331 | 0.010 | -0.582 | -0.081 | 0.924 | 1.082 |
| Occupation | |||||||
| Merchant* | 70(27.7) | ||||||
| NGO employee | 12(4.7) | -0.495 | 0.023 | -0.920 | -0.069 | 0.907 | 1.102 |
| Monthly income (ETB) | |||||||
| <500 | 44(17.7) | 0.361 | 0.005 | 0.109 | 0.613 | 0.811 | 1.233 |
| 501-1000* | 111(43.5) | ||||||
| Consultation time | |||||||
| <15 minutes* | 158(62.0) | ||||||
| 15-30 minutes | 96(37.6) | 0.330 | 0.003 | 0.114 | 0.546 | 0.675 | 1.482 |
| Perceived level stigma and discrimination | |||||||
| Low | 52(20.4) | 0.508 | 0.001 | 0.207 | 0.810 | 0.499 | 2.004 |
| Medium* | 122(47,80 | ||||||
| High | 79(31.0) | -0.232 | 0.026 | -0.436 | -0.028 | 0.827 | 1.209 |
| Perceived HIV status disclosure | |||||||
| Bad* | 160(62.7) | ||||||
| Very good | 18(7.1) | 0.608 | 0.003 | 0.213 | 1.003 | 0.719 | 1.392 |
| Perceived level of support of families, friends and others | |||||||
| Very low* | 167(65.5) | ||||||
| Medium | 22(8.6) | 0.725 | .000 | 0.402 | 1.049 | 0.891 | 1.122 |
| High | 4(1.6) | 1.381 | 0.001 | 0.550 | 2.213 | 0.915 | 1.093 |
* Reference category (categories with highest frequency taken as reference category)
Table 3: results of multivariate linear regression of reliability and responsiveness for clients satisfaction on ART, public Hospitals of West Wollega, West Ethiopia, April 2013 (n=255)
| Explanatory Variables | No (%) | Unstandardized B |
Sig. | 95 % CI Interval for B | Collinearity Statistics | ||
| Lower bound | Upper bound | Tolerance | VIF | ||||
| Characteristics of facilities | |||||||
| Nejo Hospital* | 164(64.3) | ||||||
| Gimbi | 55(21.56) | -0.430 | 0.003 | -0.710 | -0.150 | 0.959 | 1.042 |
| Occupation | |||||||
| Merchant* | 70(27.7) | ||||||
| Daily laborers | 56(22.0) | -0.318 | 0.024 | -0.593 | -0.043 | 0.984 | 1.016 |
| Frequency of visits | |||||||
| <1 month | 65(25.5) | -0.351 | 0.012 | -0.622 | -0.079 | 0.909 | 1.100 |
| 1-2 months* | 190(74.5) | ||||||
| Consultation time | |||||||
| <15 minutes* | 158(62.0) | ||||||
| 15-30 minutes | 96(37.6) | 0.758 | 0.026 | 0.065 | 1.071 | 0.768 | 1.855 |
| Perceived level of stigma and discrimination | |||||||
| Low | >52(20.4) | 0.409 | 0.016 | 0.078 | 0.741 | 0.713 | 1.402 |
| Medium* | 122(47.80 | ||||||
| Perceived HIV status disclosure | |||||||
| Bad* | 160(62.7) | ||||||
| Very good | 18(7.1) | 0.558 | 0.033 | 0.045 | 1.071 | 0.738 | 1.355 |
* Reference category (categories with highest frequency taken as reference category).
Table 4: results of multivariate linear regression of tangibility for clients satisfaction on ART, public Hospitals of West Wollega, West Ethiopia, April 2013 (n=255)
| Explanatory Variables | No (%) | Unstandardized B |
Sig. | 95 % CI for B | Collinearity Statistics | ||
| Lower bound | Upper bound | Tolerance | VIF | ||||
| Characteristics of facilities | |||||||
| Nejo Hospital* | 164(64.3) | ||||||
| Gimbi Hospital | 55(21.56) | 0.569 | 0.000 | 0.318 | 0.820 | 0.901 | 1.110 |
| Frequency of visits | |||||||
| <1 month | 65(25.5) | -0.485 | 0.000 | -0.723 | -0.247 | 0.889 | 1.125 |
| 1-2 months* | 190(74.5 | ||||||
| Consultation time | |||||||
| <15 minutes* | 158(62.0) | ||||||
| 15-30 minutes | 96(37.6) | 0.416 | 0.001 | 0.177 | 0.656 | 0.710 | 1.409 |
| Perceived level of stigma and discrimination | |||||||
| Low | 52(20.4) | .720 | .000 | .391 | 1.049 | .546 | 1.831 |
| Medium* | 122(47.80 | ||||||
| Perceived HIV status | |||||||
| Bad* | 160(62.7) | ||||||
| Very good | 18(7.1) | -0.826 | 0.000 | -1.283 | -0.369 | 0.698 | 1.433 |
| Excellent | 4(1.6) | -0.956 | 0.026 | -1.799 | -0.113 | 0.873 | 1.146 |
| Perceived level of support families, friends and others | |||||||
| Very low* | 167(65.5) | ||||||
| Medium | 22(8.6) | 0.504 | 0.007 | 0.141 | 0.866 | 0.924 | 1.082 |
| High | 4(1.6) | 2.607 | 0.000 | 1.664 | 3.550 | 0.926 | 1.080 |
* Reference category (categories with highest frequency taken as reference category).
The tangibility final model found to explain 59.0 % variability in satisfaction factor score. Accordingly, characteristics of facilities, frequency of visits, consultation time, level of stigma and discrimination, level of HIV status disclosure and level of support of families, friends and others were strong predictors of satisfaction score as explained by tangibility factor score.
Study participants who were consulted for 15-30 had an average increase of 0.416 units in their satisfaction score as explained by tangibility factor score (95 % CI: 0.177 to 0.656). Respondents who rated perceived level of stigma and discrimination within Hospitals and outside in the community as low had an average increase of 0.720 units in their satisfaction score as compared those rated as medium (95 % CI: 0.391 to 1.049). In similar manner as one move from very low to high across perceived level of support of families, friends and others the regression estimated increase positively. Respondents who rated the level of support families, friends and others as medium and high had an average increase of 0.504 and 2.607 units in their satisfaction score as compared to study participants who rated as very low respectively (95% CI: 0.141 to 0.866 and 1.664 to 3.550). Table 4 below quantified the regression estimate of predictor variables on satisfaction score as explained by tangibility factor score and only variables showed significant association were displayed.
DISCUSSION
This study identified 57.2 % overall level of client satisfaction, the underlying latent factor (variables) that determine the level of satisfaction and predictor variables such as characteristics of facilities, monthly income, occupational status, consultation time and perceived level of stigma and discrimination towards ART services in Western Wollega Zone Public Hospitals ART clinics.
The overall level of client satisfaction may indicate how health care systems are performing and how likely they are satisfying health care consumers and their respective families as satisfied and dissatisfied clients behaved differently. (13-20,23-25) The present study found that the overall level ART client satisfaction was 57.62 %. This finding is lower than the studies conducted in Ethiopia, Jimma University Specialized Hospital (JUSH) on ART clients and Nigeria which were documented as 66.8% and 83.0 % respectively. (26,13) The potential reasons for this discrepancy may result from the fact that the previous both studies were conducted in specialized teaching Hospitals where more health professionals with different categories are abundant and fully equipped than the present study areas (district hospitals) and difference in the study areas. High overall level of client satisfaction quotient implies that the services rendered by the health care system is met perception of clients and shows good attitudes towards health care system. Furthermore, satisfaction measurement is a relevant instrument for administration and planning.
Tangibility (physical facilities) of health facilities is important component that influence client satisfaction level with health care services. Cleaning of healthcare facilities is performed for medical and cultural reasons. (23,27,28) Findings from this satisfaction survey indicated that the least mean score was recorded for tangibility aspects of satisfaction with mean score of 1.95 (39.0 %). This result is in agreement with other studies conducted in other areas reported as the tangibility aspects of Public health facilities; particularly cleanliness of different areas within facilities was poorly rated (27,28)and this shows that tangibility aspects of health facilities could affect client satisfaction with health care services during their waiting time, laboratory and pharmacy services.
Understanding the underlying (latent) factors that can influence the level of client satisfaction can be used to identify the gap and indicates room for more improvement. The latent variable or factors is taken to be unobservable characteristics of people on which people differ in extent or degree and they are more fundamental than observed factor. This study confirmed that one can determine the level of client satisfaction through the three underlying latent factors identified as client provider interaction and assurance, reliability and responsiveness and tangibility. This result was comparable with other studies conducted elsewhere irrespective of their differences. (17,23,29)
Consultation time has pronounced positive or negative impacts in health care system. When consultation time is too short client feels their conditions were not addressed well and develop dissatisfaction. In addition consultation time is necessary to teach health care consumers about their conditions and give chance to clients in shared decision making of their health choices (23,26,30-37)
This study revealed that more than half (62.0%) of the respondents were consulted for only less than 15 minutes by their ART staffs and peer educators (sero-positive counselors) which is lower than other study conducted in health center of Central Ethiopia in which 81.3% of health care client were consulted for only less 15 minutes. (38)The potential reasons for this difference may result from the fact that the previous study was conducted in lower level health facilities where there is no enough trained health professionals at the time and on all outpatient department whereas this study was conducted only at ART clinic with low client flow.
In addition to that consultation time had statistically significant association with satisfaction score. Respondents who were consulted for 15-30 had an average of 0.758 units increase in their satisfaction scores as compared to respondents who were consulted for less than 15 minutes as explained by reliability and responsiveness satisfaction score. This satisfaction score was higher when compared to study done on out patients in public Hospitals found in Addis Ababa which was 0.095 units. (39) The probable reasons to this difference may result from the fact that ART client and their provider has a sort of intimacy than new/repeated outpatient client. Due to the nature of HIV/AIDS, this consultation time is not satisfactory. Consultation time has great impacts as PLWHAs have different psychological and socio- economic problems in addition other health problems created by the disease and as a result needs thoroughly counseling.
Stigma and discrimination are factors that hinder PLWHAs from utilizing the available ART services appropriately. Stigma is negative attitudes towards people living with HIV on the basis of particular attributes such as their HIV status whereas discrimination refers to manifestation of stigma. (2-5) This result indicated that 31.0% of the respondents rated the perceived level of stigma and discrimination as high which is slightly higher than study conducted in India which was 24 %. (33) The discrepancy may be occurred due to the difference in both the health system settings and community context. Furthermore perceived level of stigma and discrimination had statistically significant association with satisfaction score. As one move from low to high across perceived level of stigma and discrimination the regression estimates increases negatively indicating as level of stigma increase the satisfaction score decreases oppositely.
Despite this, the communities (particularly health care professionals) have a promise not to stigmatize and discriminate their clients on the basis of their disease type, race, sex and etc. So that PLWHAs should be considered as other individuals or health care consumers.
Socio demographic back ground of study participants has great influences on level of client satisfaction as other determinants of satisfaction. Studies conducted in different parts of country and elsewhere in developing countries indicated socio demographic of respondents and satisfaction had statistically significant association. (13,17,23,29,38,39) Findings from this study are also in agreement with those studies. For instance, Study participants who were daily laborers had average decrease of 0.318 units in their satisfaction factor score as compared to study participants who were merchant as explained by reliability and responsiveness factor score (95% CI: -0.593 to -0.043). This may result from the socio economic status difference between the two groups.
In other way round these findings are in contrary to other study done on clients’ satisfaction with ART services at Jimma University specialized Hospital which was reported as no significant differences were observed in mean satisfaction scores when analyzed by gender, ethnic group, age, employment status and marital status. (26)
CONCLUSION
This study showed lower clients’ satisfaction level in the Public Hospitals of Western Wollega Zone ART clinics. Satisfaction level of the client differed based on facilities characteristics showing better Hospitals can more satisfied their clients than poorly equipped Hospitals in general.
Client provider interaction and assurance, reliability and responsiveness and tangibility were the three underlying latent factors that determined level of client satisfaction towards ART services in Western Wollega Public Hospitals. Tangibility aspects of satisfaction (organization of services environment, convenience of facility location and facility cleanliness) were poor. Findings from this study also pointed out that clients’ satisfaction with ART services had statistically significant association with socio-demographic characteristics like marital status, monthly income, and occupational status of ART users in Western Wollega Zone. The main sources of ART clients’ dissatisfaction documented in this study were consultation time, perceived level of stigma and discrimination and perceived level of support of families, friends and others organization. In the mean time we recommends that, Governing boards and managers of Public Hospitals in Western Wollega Zone should work hard in order to improve the overall level of client satisfaction.
ACKNOWLEDGEMENTS
We acknowledge Jimma University for funding this study. We are also grateful to the study participants for their voluntary participation.
REFERENCES
- U.S Global Health Policy. Global HIV/AIDS Epidemics. Washington DC: Kalser Family Foundation; 2012. http://kff.org/…-sheet/the-global-hivaids-epidemic/: Accessed on January 4, 2013.
- UNAIDS. Report on Global AIDS Epidemics. Geneva: Switzerland; 2012. http://issuu.com/…0121120_unaids_global_report_2012: Accessed on December 25, 2012.
- WHO. Standard for quality HIV care: a tool for quality assessment, improvement and accreditation. Geneva: Switzerland; 2004. http://www.who.int/…ev_care/en/standardsquality.pdf: Accessed on December 24, 2012.
- USAIDS.HIV/AIDS Health profile: Sub- Saharan Africa. New York: USA; 2012
- UNAIDS. Scaling Up Antiretroviral Therapy in Developing Countries. Geneva: Switzerland ;2011
- WHO. Brief on Antiretroviral therapy (ART) in HIV and TB prevention: Geneva: Switzerland; 2011. http://www.who.int/…r_prevention_brief_jan_2011.pdf: Accessed on January 1, 2013.
- WHO. HIV status disclosure to sexual partners: Rates, Barriers and Outcomes for women Geneva: Switzerland; 2004. http://www.who.int/…cuments/en/genderdimensions.pdf: Accessed on January 1, 2013.
- Sarah N.Ssali., Lynn A., Christopher T., Eric S., Nicolate N., Annet N., Gery R., Glenn W. Reasons for disclosure of HIV status by people living with HIV/AIDS and HIV care in Uganda: An Exploratory study. AIDS patient care and STDs. 2010; 24(10).
- WHO. Developing countries offering free access to HIV treatment: Fact Sheet. Geneva: Switzerland; 2006. http://www.who.int/hiv/countries_freeaccess.pdf: Accessed on January 1, 2013.
- FMOH. Guideline for implementation of antiretroviral therapy in Ethiopia. Addis Abeba: FMOH; 2005.
- Federal HIV/AIDS Prevention and Control Office, Ministry of Health. Guideline for HIV Care/ART Clinical Mentoring in Ethiopia. Addis Abeba: FMOH; 2007. http://www.etharc.org/…sources/download/finish/33/72: Accessed on December 27, 2012. 46
- Ethiopia HIV/AIDS Prevention and Control Office (HAPCO) and Global AIDS Monitoring & Evaluation Team (GAMET). HIV/AIDS in Ethiopia- An Epidemiological Synthesis. Addis Abeba; World Bank Global HIV/AIDS Program; 2008. http://siteresources.worldbank.org/…thesisFinal.pdf: Accessed on December 27, 2012.
- Iliyasu Z., Abubakar IS., Abubakar S., Lawan UM, Gajida AU. Patients' satisfaction with services obtained from Aminu Kano Teaching Hospital, Kano, and Northern Nigeria. Niger J Clin Pract. 2010; 13(4):371-378.
- Denise F., Carlos E., Edmea R. and Newton K. Quality of health care: patient satisfaction in a University Hospital. Arq Bros Oftalmol. 2006; 69(5): 731-6.
- Stephen J.and Sabina B. Patient satisfaction theory and robustness across Gender in Emergency department: A multi group structural modeling investigation. American Journal of Medical quality. 2003: 8(6): 229-41.
- Yu-Ying H., Shyh-Jane L. and Miles M. How and when service quality and satisfaction simultaneously influence purchase intentions? Health Services Management Research. 2011; 24: 121-9.
- Doris K. A comparative analysis of client satisfaction among people receiving HIV/AIDS care from public and private health facilities in Kabale district. Uganda; (unpublished work). 2010. http://mak.ac.ug/…Makfiles/theses/Kwesiga_Doris.pdf: Accessed on January 23, 2013.
- Center for clinical governance research. Complaints and patients satisfaction: A comprehensive review of the literature. Sydney: University of New south Wale; 2009:5–-.
- Afshan K., Muhammad I., Muhammad A. Patient satisfaction- A comparison between public and private hospital of Peshawar. International Journal of Collaborative Research on Internal Medicine & Public Health. 2011; 4(5).
- Dr.Kashinath KR., Dr. Bharateesh JV., Dr. Chandan A., Dr. Mythri H., Dr. Darshana B., Dr. Mohan K. Factors affecting patient satisfaction among those attending an outpatient department of Dental College in Tumkur City- A Survey. Journal of Dental sciences and Research. 2010; 1(2):1-10
- FMOH. Health Sector Development Program IV in line with GTP 2010/11-2014/15. Addis Abeba: FMOH; 2011. http://www.ausaid.gov.au/…esign-summary-imp-doc.doc: Accessed on January 6, 2013.
- New York State Department of Health, AIDS Institute. Patient Satisfaction Survey for HIV Ambulatory Care (PSS-HIV). New York; 2002. http://cdn.hivguidelines.org/wp-content/uploads/2009/06/pss-hiv_091802.pdf: Accessed on January 11, 2013.
- Abebe B., Girum T., Yared M., Woldemariam G., Ambaye D., Asnakech M., et al. Levels of outpatient satisfaction at selected health facilities in six regions of Ethiopia. Ethiopia J.Health Dev. 2008; 22(1):42–8.
- Agency for health care quality. Expanding patient-centered care to empower patients and assist providers. 2002. http://www.ahrq.gov/legacy/qual/ptcareria.htm: Accessed on January 3, 2013.
- Rasheed N., Arya S., Acharya A., Khandekar J. Client satisfaction and Perceptions about quality of health careat primary health center of Delhi, India. Indian Journal of Community Health. 2012; 24(3):237–42.
- Forum on translating research into quality health care for Veterans, August 2010. http://www.research.va.gov/…/pubs/docs/forjun00.pdf: Accessed on January 10, 2013.
- Ruzanna G. Investigating Reasons for High Patient Satisfaction Given Low Utilization of Health Care Services, Armenia; 2007. http://chsr.aua.am/…F/MPH/2007/GrigoryanRuzanna.pdf: Accessed on January 10, 2013.
- Obua C., Gusdal A.,Waako P. Multiple ART program create a dilemma for providers to monitor ARV adherence in Uganda. The Open AIDS Journal. 2011; 5:17-24
- Chimed-Ochir O. The perceived quality of healthcare service and patients‘ satisfaction in district hospitals, Ulaanbaatar city. Mongolia: Ritsumeikan Asia Pacific University; 2010. http://r-cube.ritsumei.ac.jp/… THESIS FINAL.pdf: Accessed on January 5, 2013.
- Fitzpatrick R., Sitzia W. Consumer satisfaction with occupational health services: should it be measured? 1997. http://oem.bmj.com/content/58/4/272.full: Accessed on January 10, 2013.
- American College of Healthcare Expenditure. Achieving safe and Reliable healthcare; Strategies and Solutions. 2006. http://www.pohly.com/books/achievingsafe.html: Accessed on January 10, 2013.
- GFATM7. Strengthening Institutional Capacity for Nursing Training on HIV/AIDS in India: Satisfaction Survey Midline Assessment. 2011
- Donabedian A. The seven Pillars of Quality. 1990. http://www.ncbi.nlm.nih.gov/pubmed/2241519: Accessed on January 10, 2013.
- Umar I., Oche M.O and Umar A.S: Patient waiting time in a tertiary health institution in Northern Nigeria. Journal of Public Health and Epidemiology. 2011;3(2):78-82
- Jorge M., Helga P and Ahmed A: Client satisfaction and quality of health care in rural Bangladesh. Bulletin of the World Health Organization. 2001;79 (6)
- Liz C., Justine V.S. and Nancy V.Y: Client- Centered quality; new perspectives on quality of care. Second edition; 1996
- Fekadu A., Andualem M., Yohannes H/M. Assessment of clients‘satisfaction with health service deliveries at Jimma University Specialized hospital. Ethiop J Health Sci. 2011; 21(2):101-9.
- Tayu T., Mirkuzie W., Shimeles O. Determinants of patient satisfaction with outpatient health services at public and private hospitals in Addis Abeba, Ethiopia. Afr J Prm Health Care Fam Med: 2012; 4(1), Art. #384, 11 pages. http://dx.doi.org/10.4102/phcfm.v4i1.384: Accessed on January 6, 2013.
- Helena G., Abraham H., Ayalew T. Clients‘satisfaction with Anti-Retroviral Therapy services at Jimma University Specialized Hospital. Ethiop J Health Sci.: 2008; 18(2).
How to cite this article: Habtamu A, Kifle Y, Ejigu Y. Client satisfaction and it’s determinants with anti-retroviral therapy (ART) services in public hospitals of west Wollega zone, Ethiopia: a cross sectional study. Galore International Journal of Applied Sciences & Humanities. 2017; 1(1): 1-16.
******
[PDF Full Text]